LAquis SCADA software is very flexible system with many resources available in the management reporting area, for any project. Each report model, is like a spreadsheet with formulas, statistics and quality, with the automation process information, retrieved from the communication with the programmable logic controller.
The simplest way to start the SCADA system report is as follows, 4 four steps:
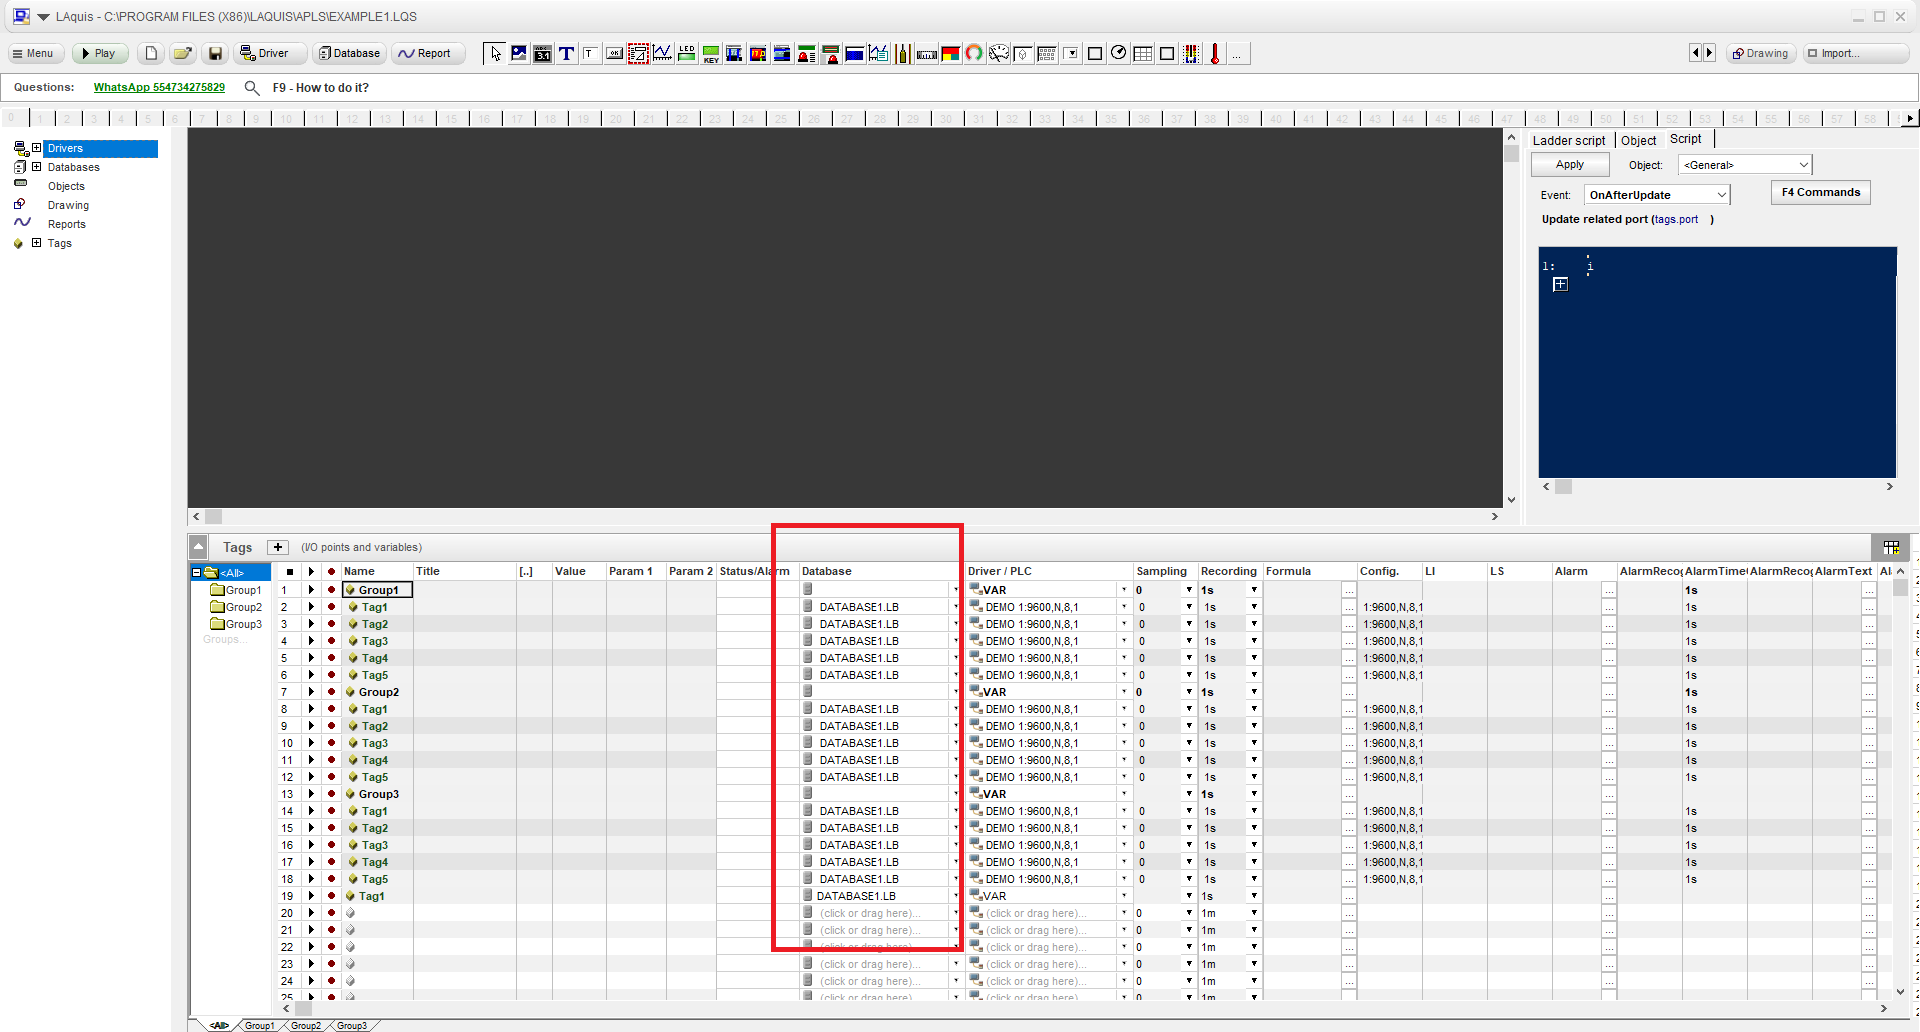
1 – Before, if you have not created, define a historical database in the project. Click in the Database column to define a database. Set a recording interval in the Recording column (best performance 1m – 1 minute). In this example, 1s will be placed for testing. Click the Play button to have it automatically create the historical database if you haven’t already.
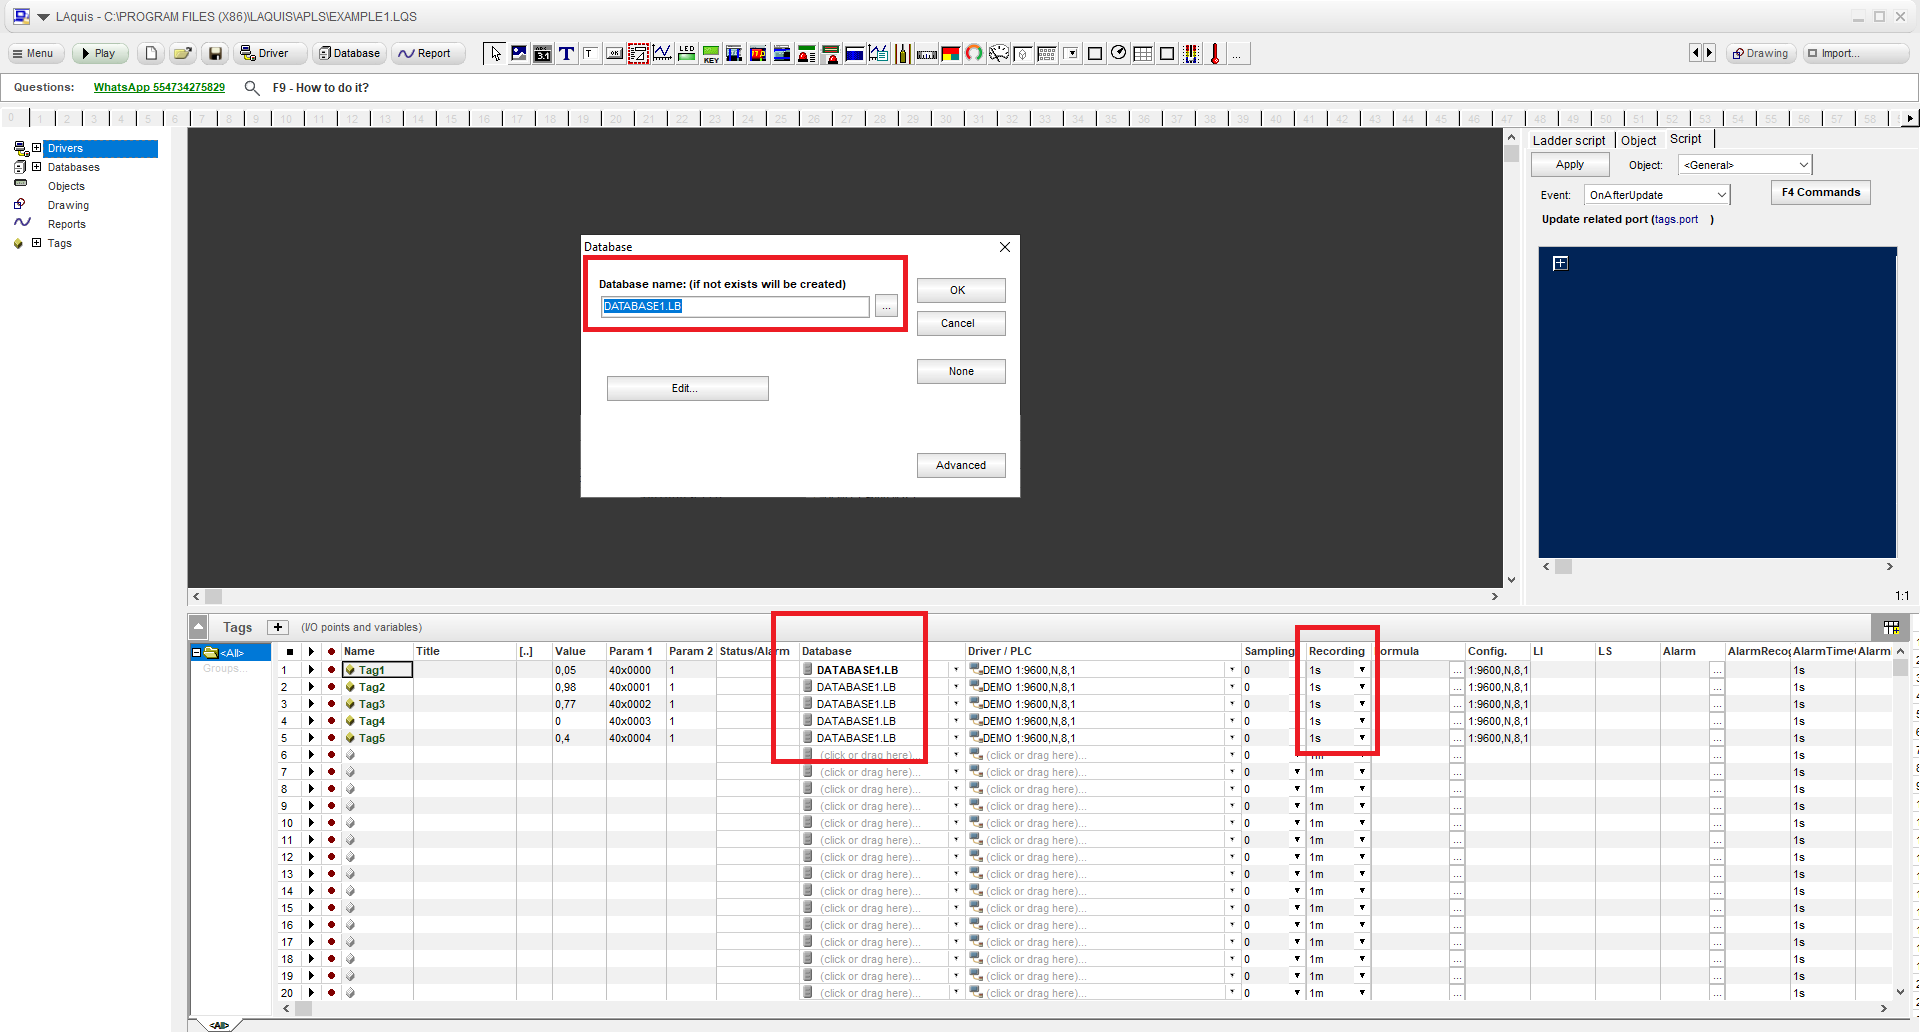 Then click Stop to start generating the report.
(Historical database of the data information is recommended to be created automatically just by defining its name. If the historical database was created manually, it is recommended to configure to be divided by date internally. See the most complete procedure here: How to create a Database)
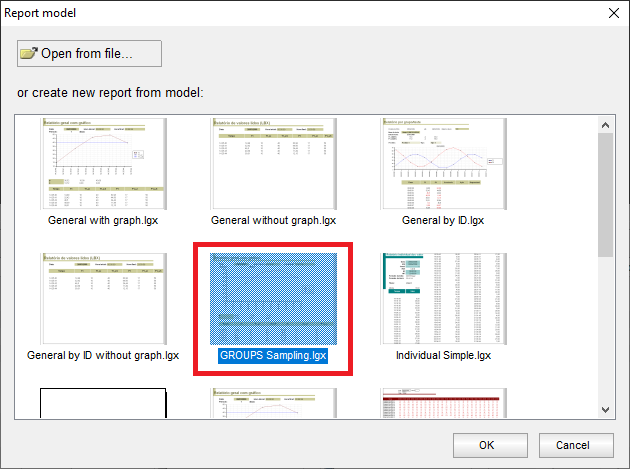
2 – Click on the “Report” button and select a model.
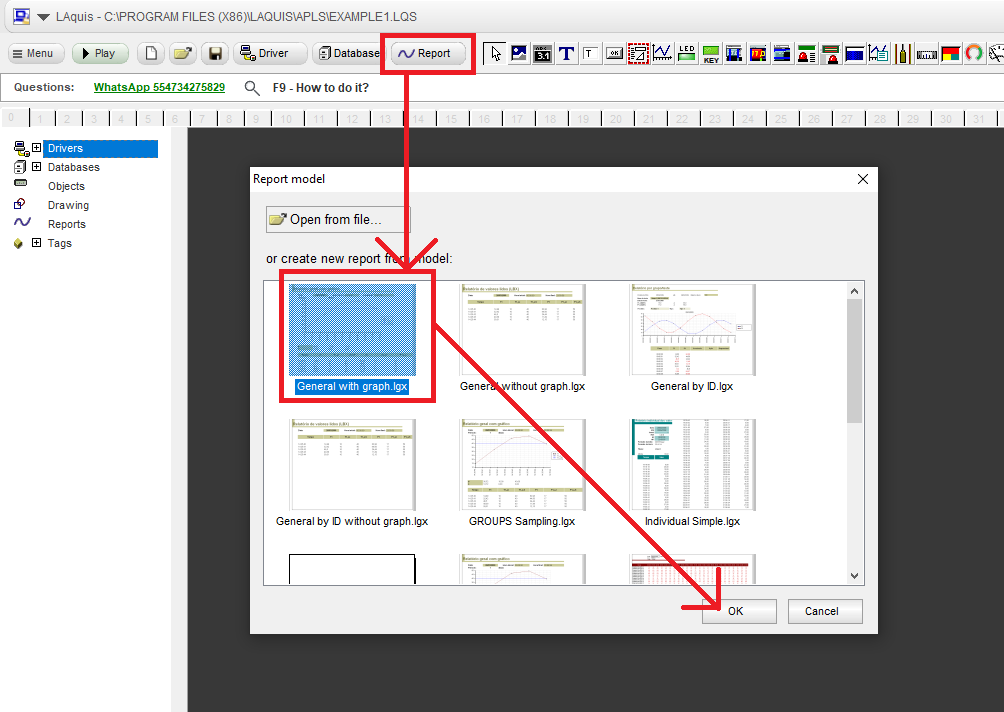 3 – Click OK and type a name for this report format. In this example reportexample1.lgx
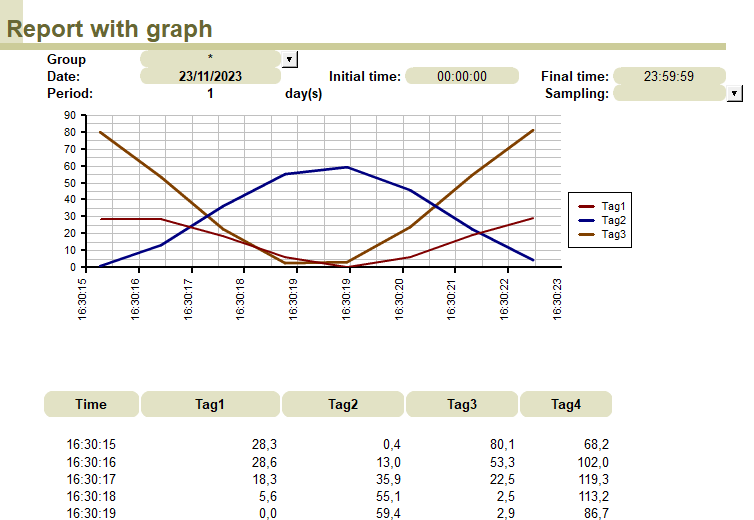
4- Click Save. He will open the report.
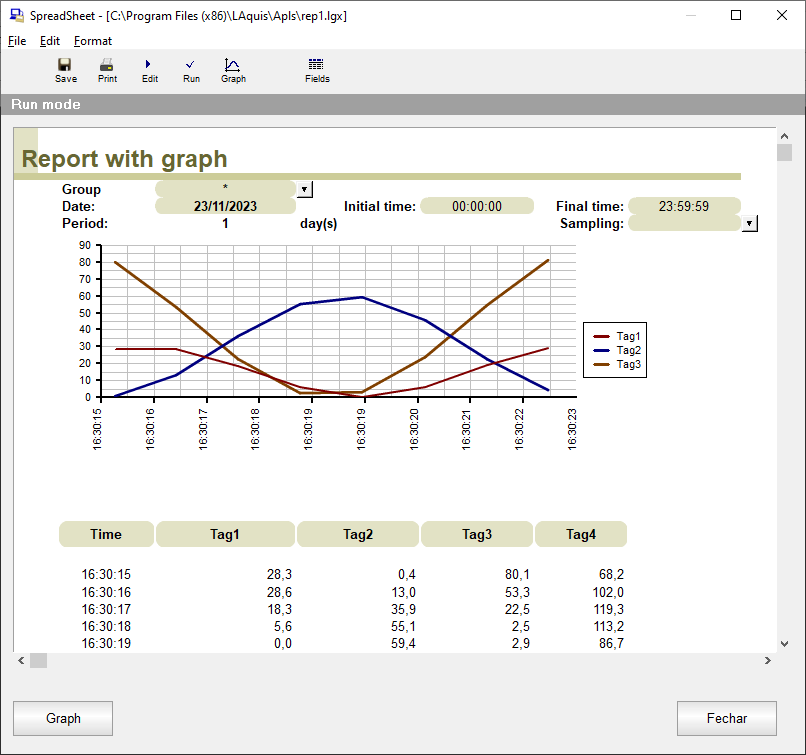
To customize the report format/layout/calculations click on the Edit button:
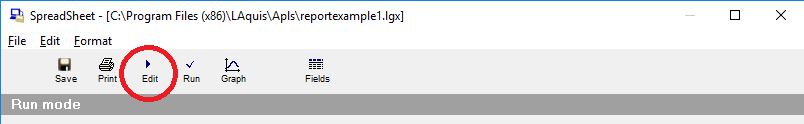
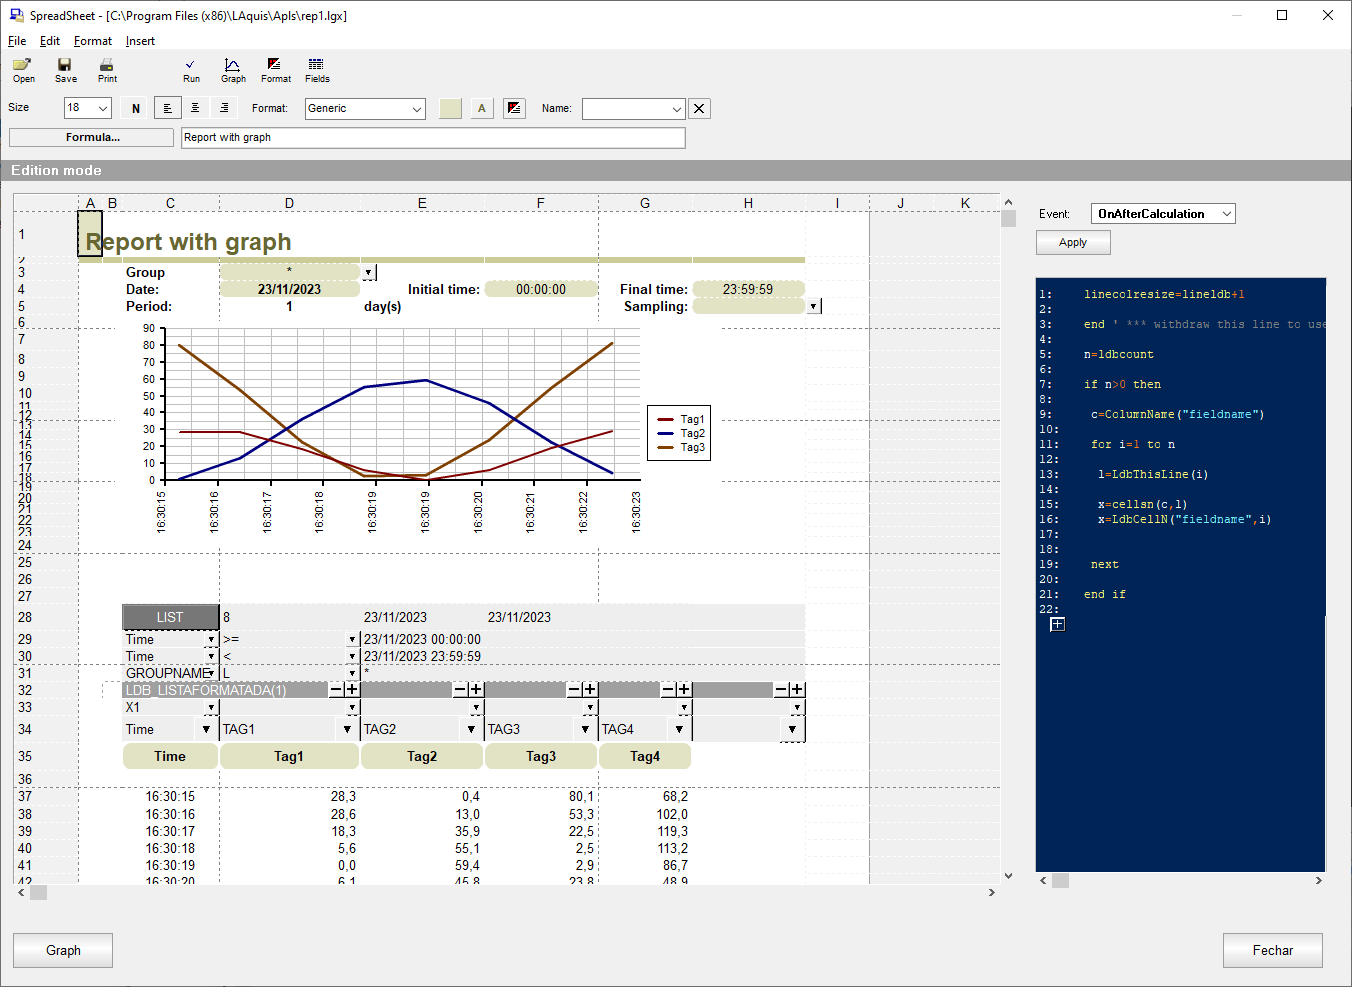
It opens the spreadsheet for editing the format, formulas, script, etc …:
 More details on customizing and editing the report will be shown later in this text, item Customizing the report.
Before that, let’s see how to make the report available to the user:
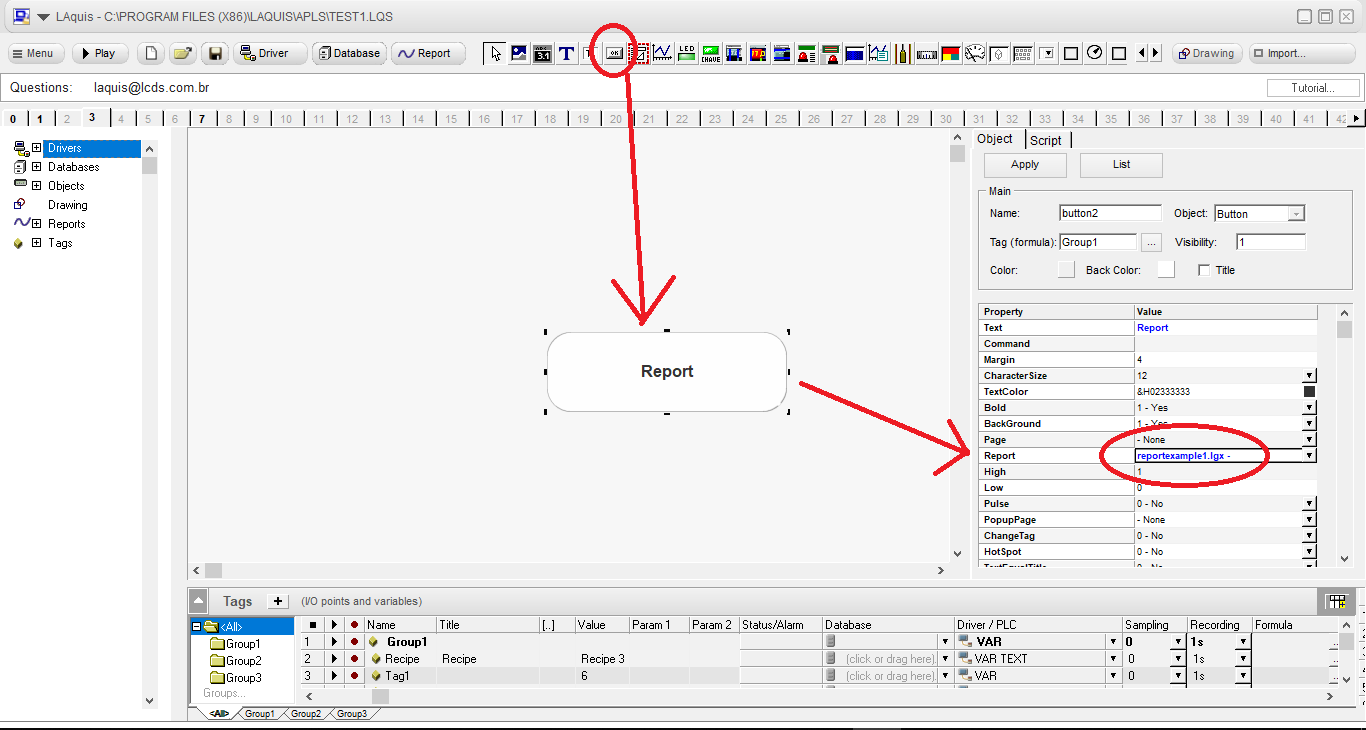
To place a button for the user to call the report, place a button on the screen, and put the file name of the report format created in the “Report” property.
It is often recommended that database be separated by groups with the same or similar tags. Each group would be, for example, a machine, sector, equipment, line, unit, etc …
The database would be defined like this, with the same tags, for example:
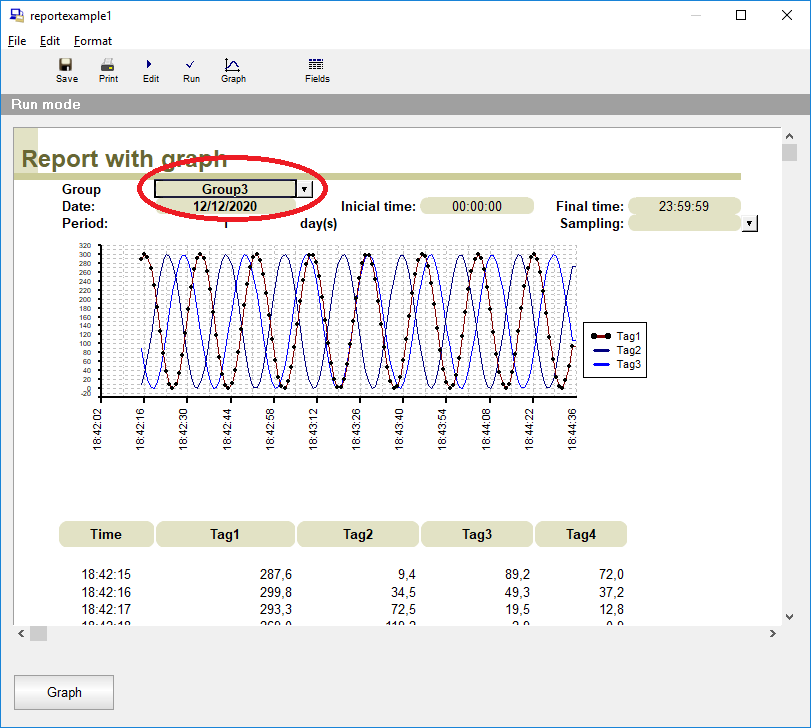
 And the same report created earlier will be separated automatically by group like this:
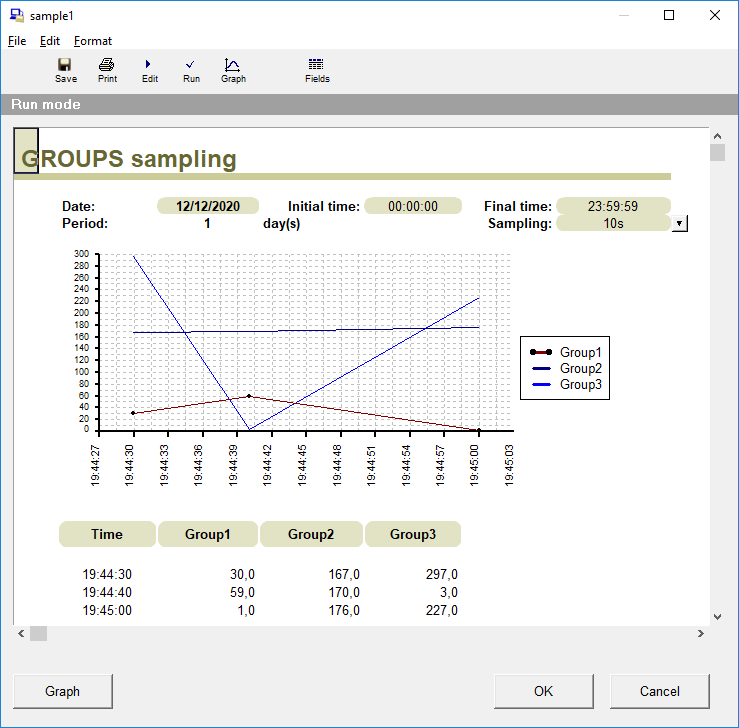
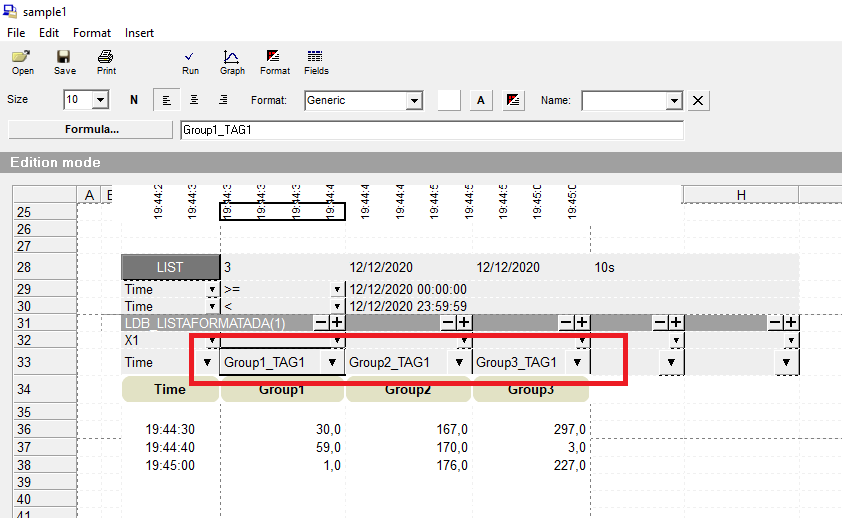
 And if you want to join several groups in the report, then you can use, for example, the Sampling Groups model.
Thus, with defined sampling (in this case every 10 seconds):
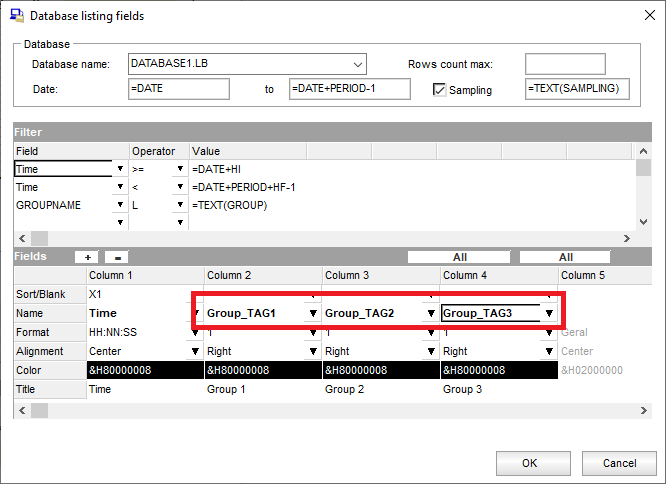
Where each tag is defined by group_tag, example Grupo1_Tag1
Customizing the report:
Pressing the Fields button, the fields can be defined like this:
In the Edit mode the fields can be defined like this:
In Edit mode formulas can be created in the cells.
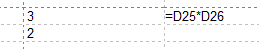
Example of simple multiplication:
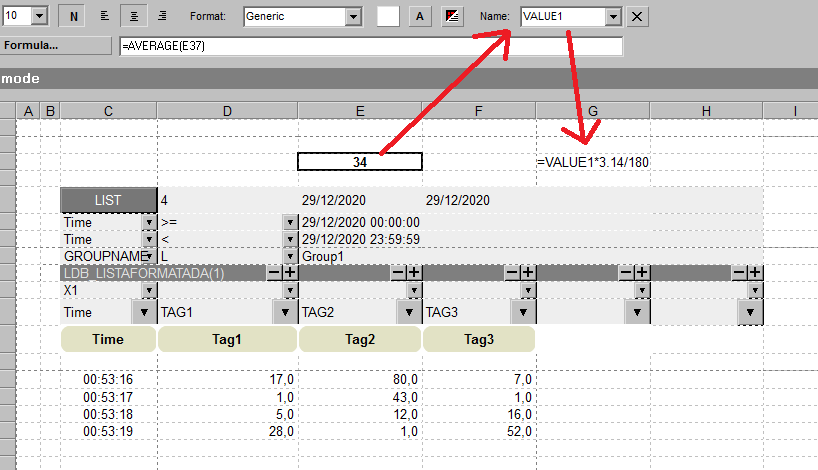
Example of calculation from the database data. Average of the column Tag1: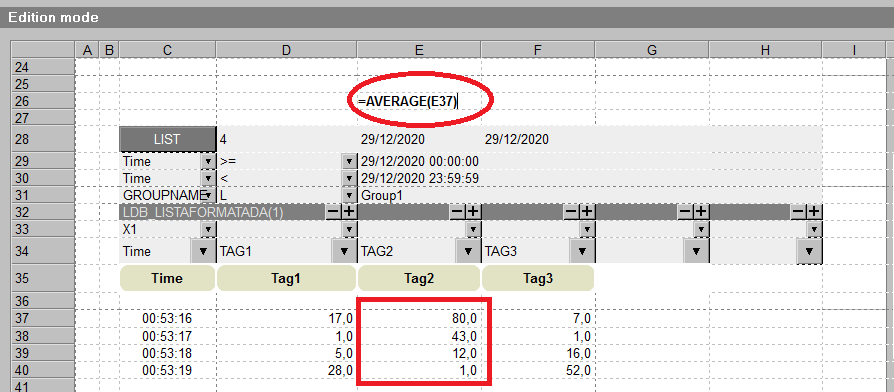
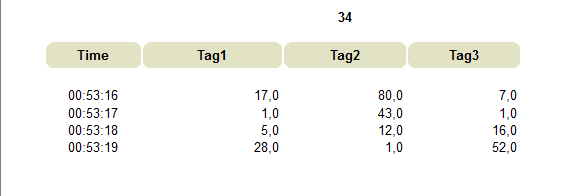
became this:
Example defining a name to the cell and using it in the formula.
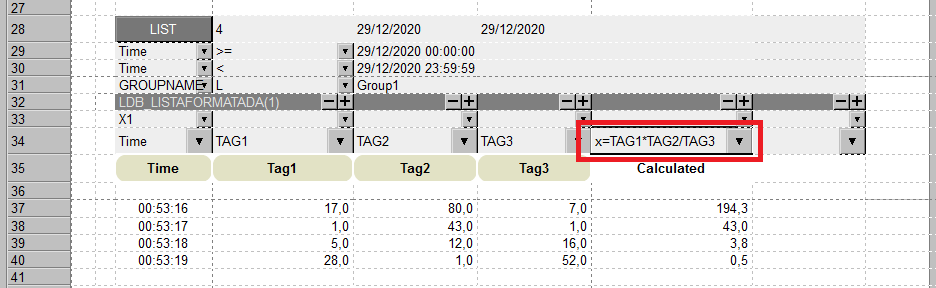
Example of creating a formula column in the main database table:
Advanced calculation using script (statistics, certificates, test report, ISO, etc..):