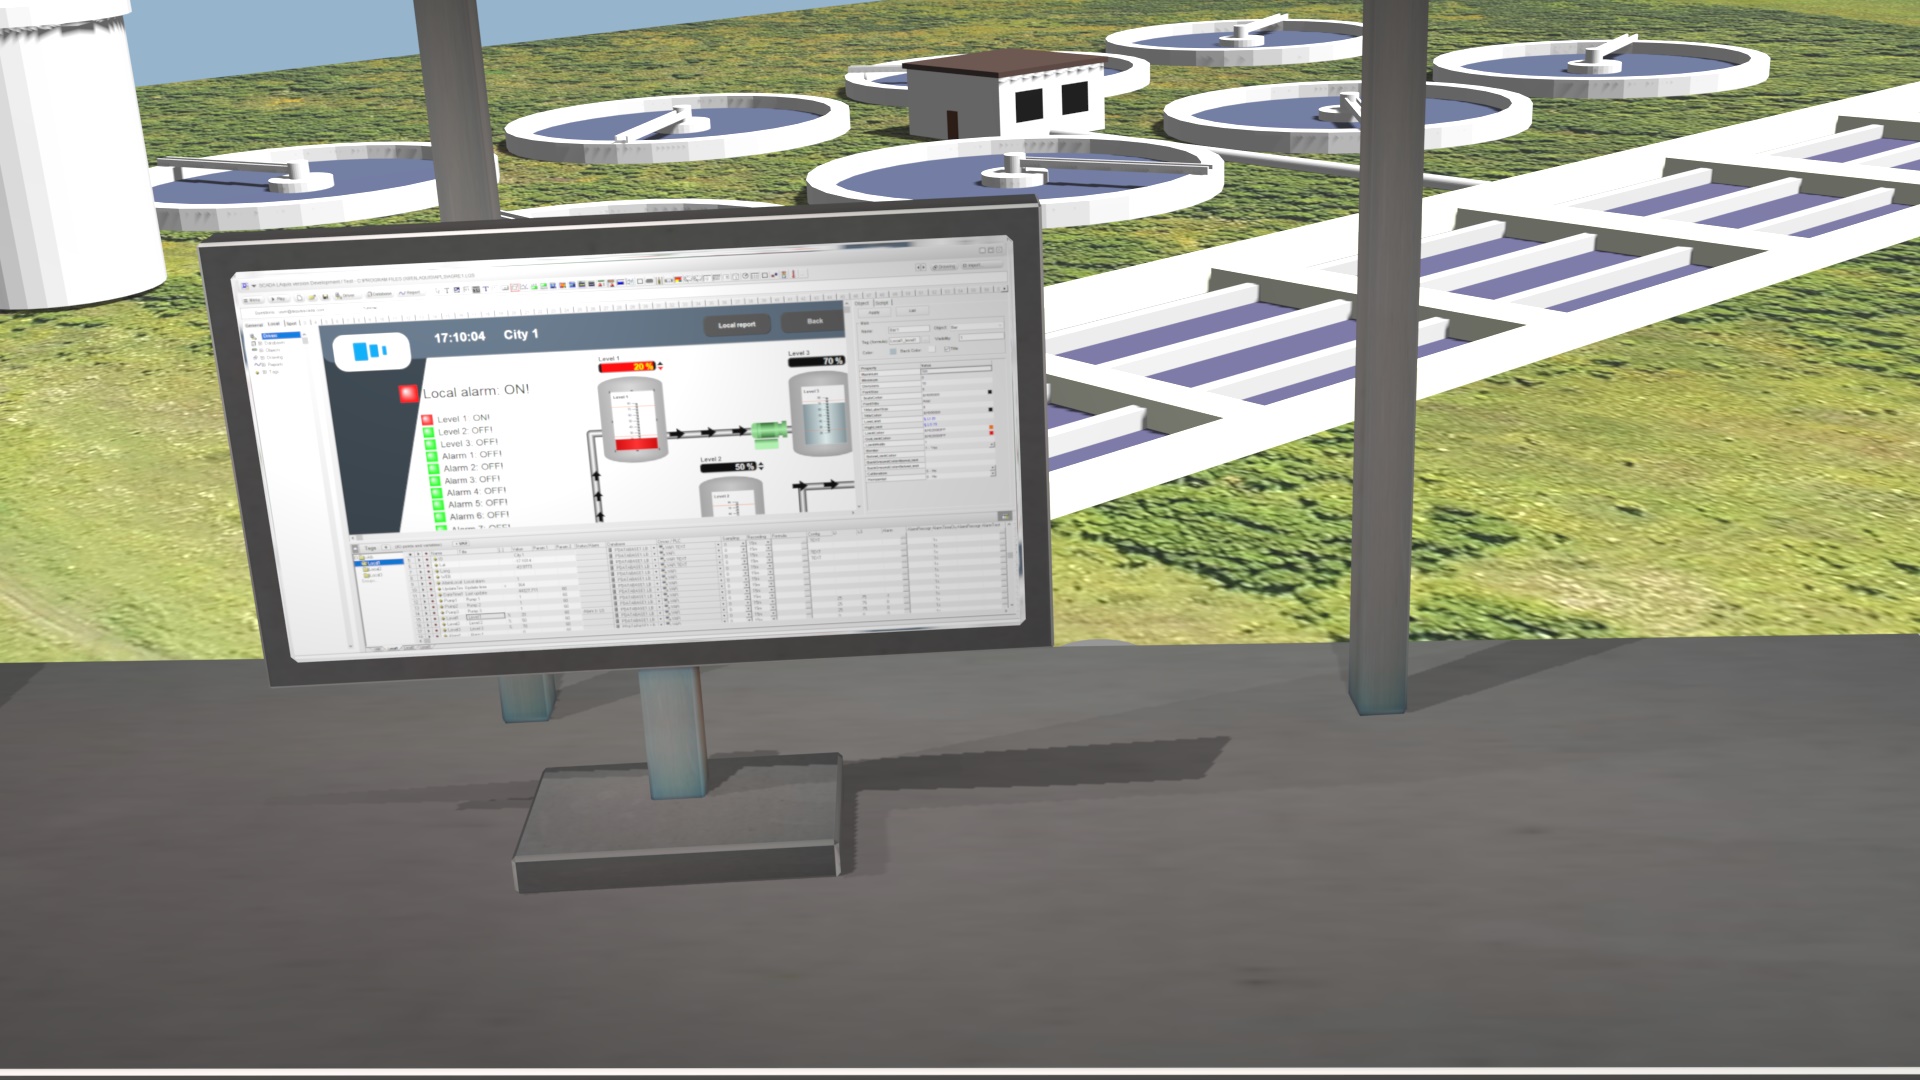
Example of water treatment monitoring.
2 – Then, after, download the example here, unzip it in a new folder, and open with the LAquis SCADA, this project: agre1.lqs. Click on Play to test.
Explanation:
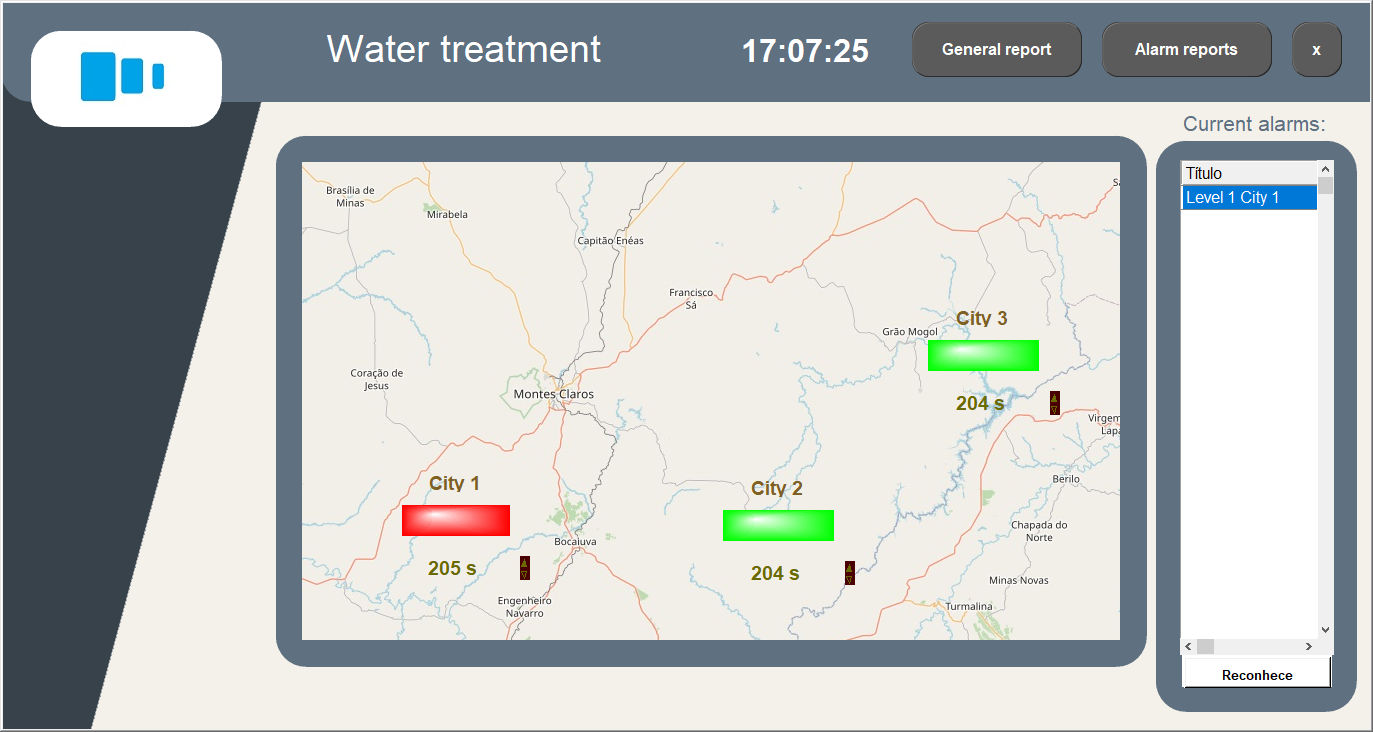
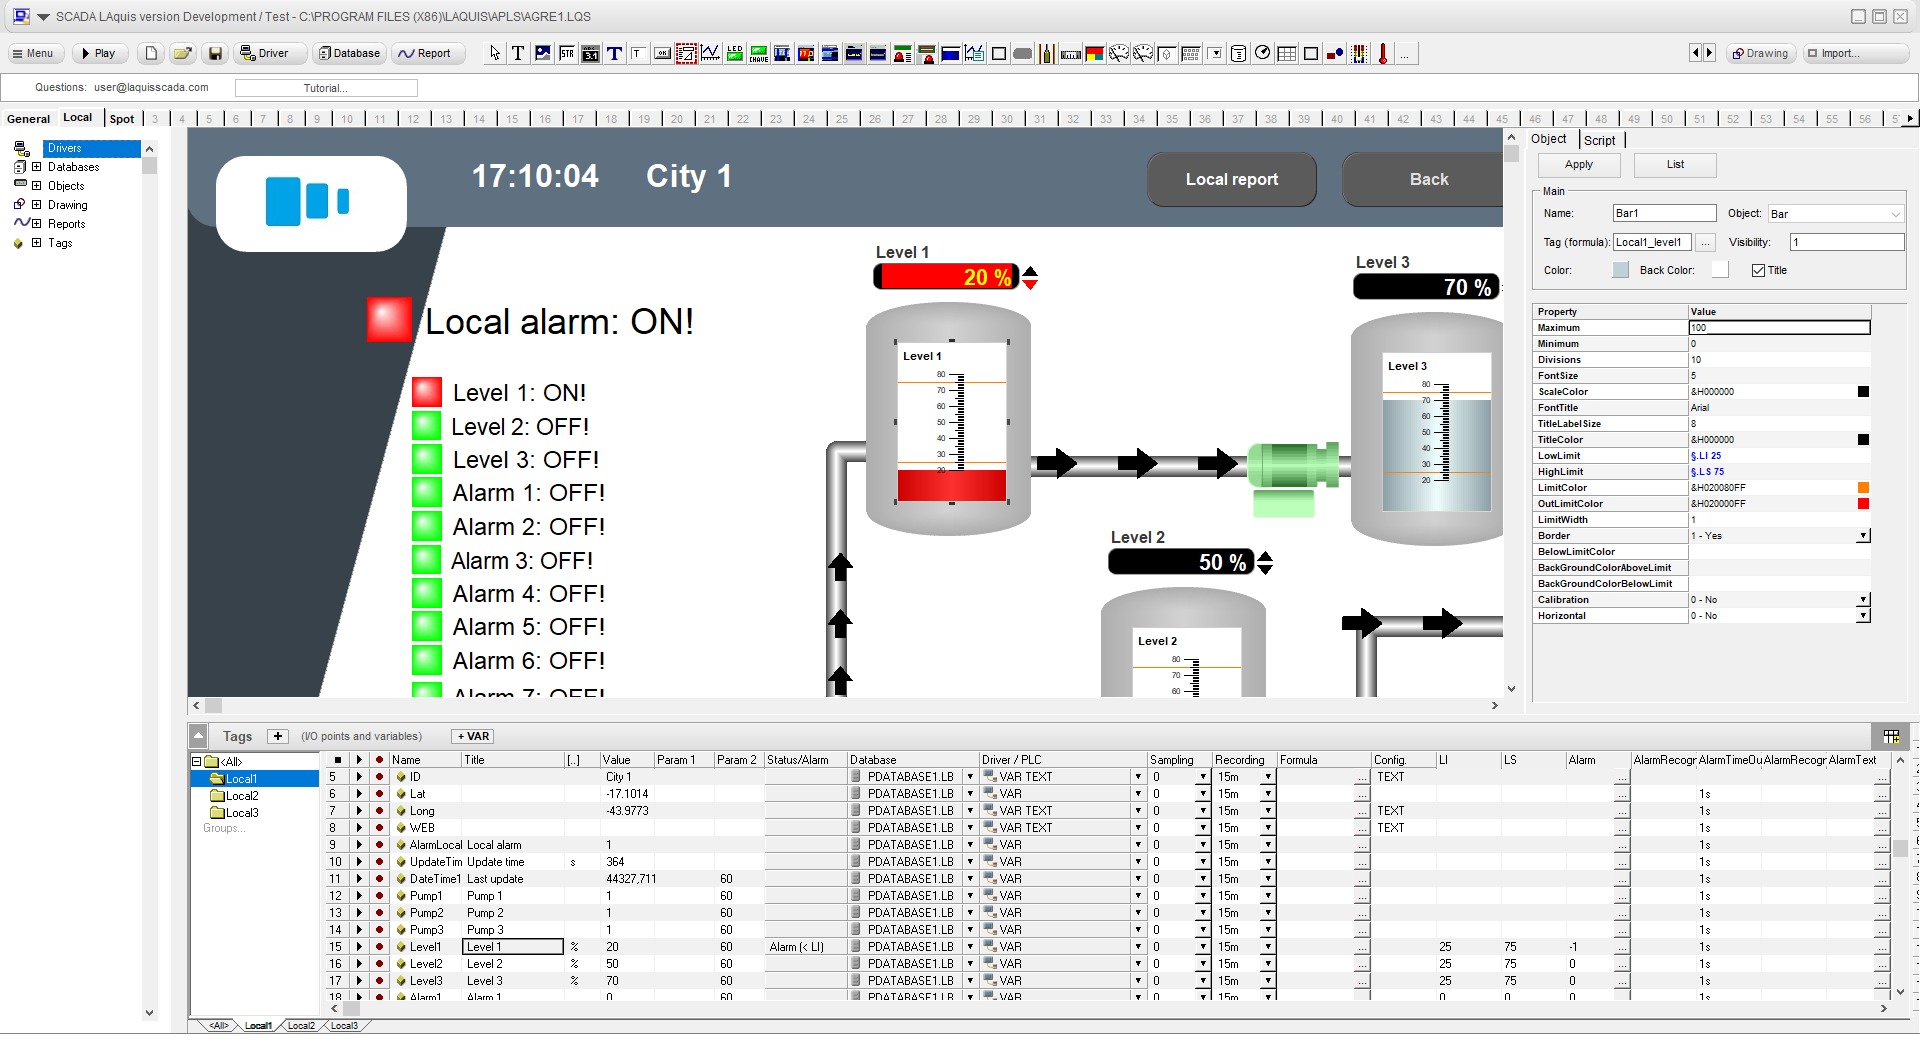
At run time, when the user clicks on the Spot page object, the Local panel and its objects are automatically associated with the chosen location.
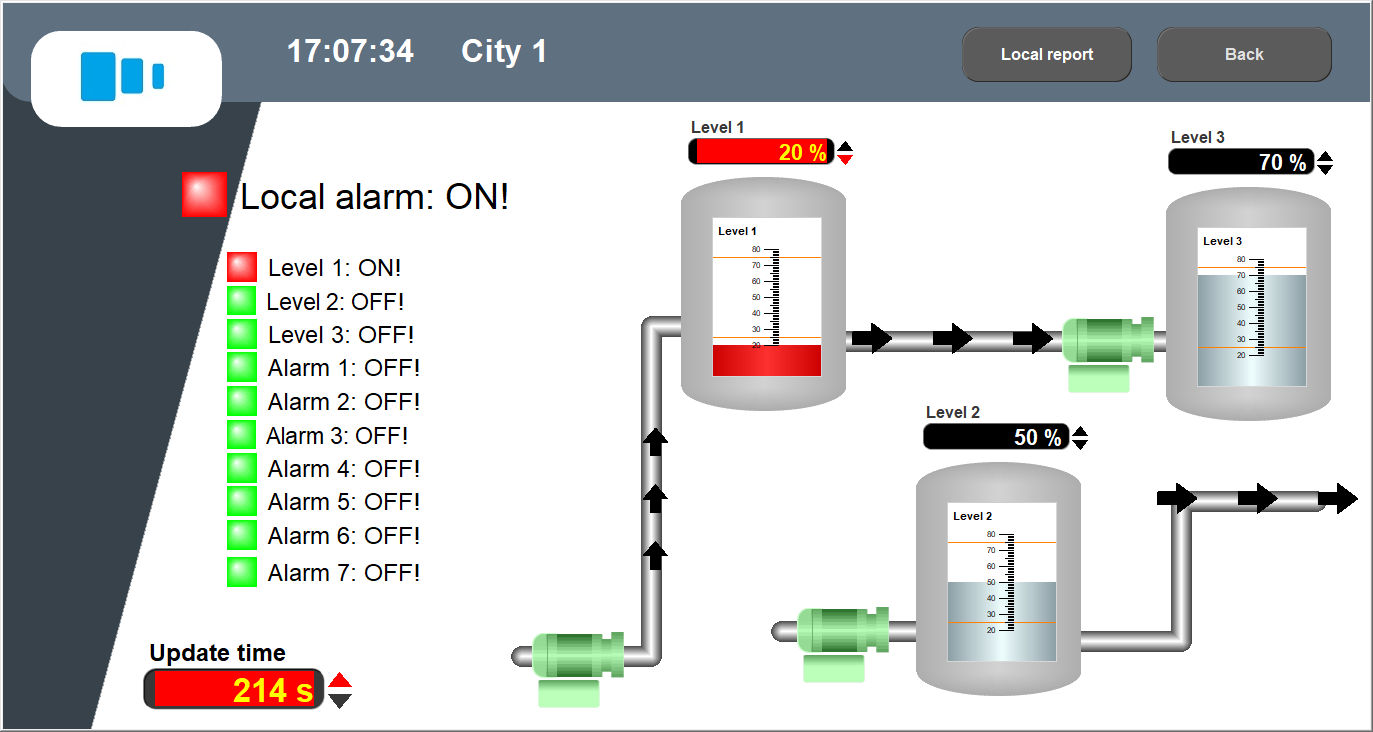
This example is divided by each group of tags as locals (can be cities, locations, places, units, etc..)
Each group (local) has the tags
ID – name of the place.
AlarmLocal – Local alarm count.
Pumps: Pump1, Pump2, Pump3… (1 is ON, 0 is OFF)
Levels: Level1, Level2, Level3… (0 to 100%)
Generic Alarms: Alarm1, Alarm2, Alarm3… (1 is ON, 0 is OFF)
DateTime1: Optionally telemetry last update time
UpdateTime: Optionally telemetry seconds from last update time
Lat, Long: Optionally latitude and logitude for WEB.
….
In the General panel, cities are associated with each location.
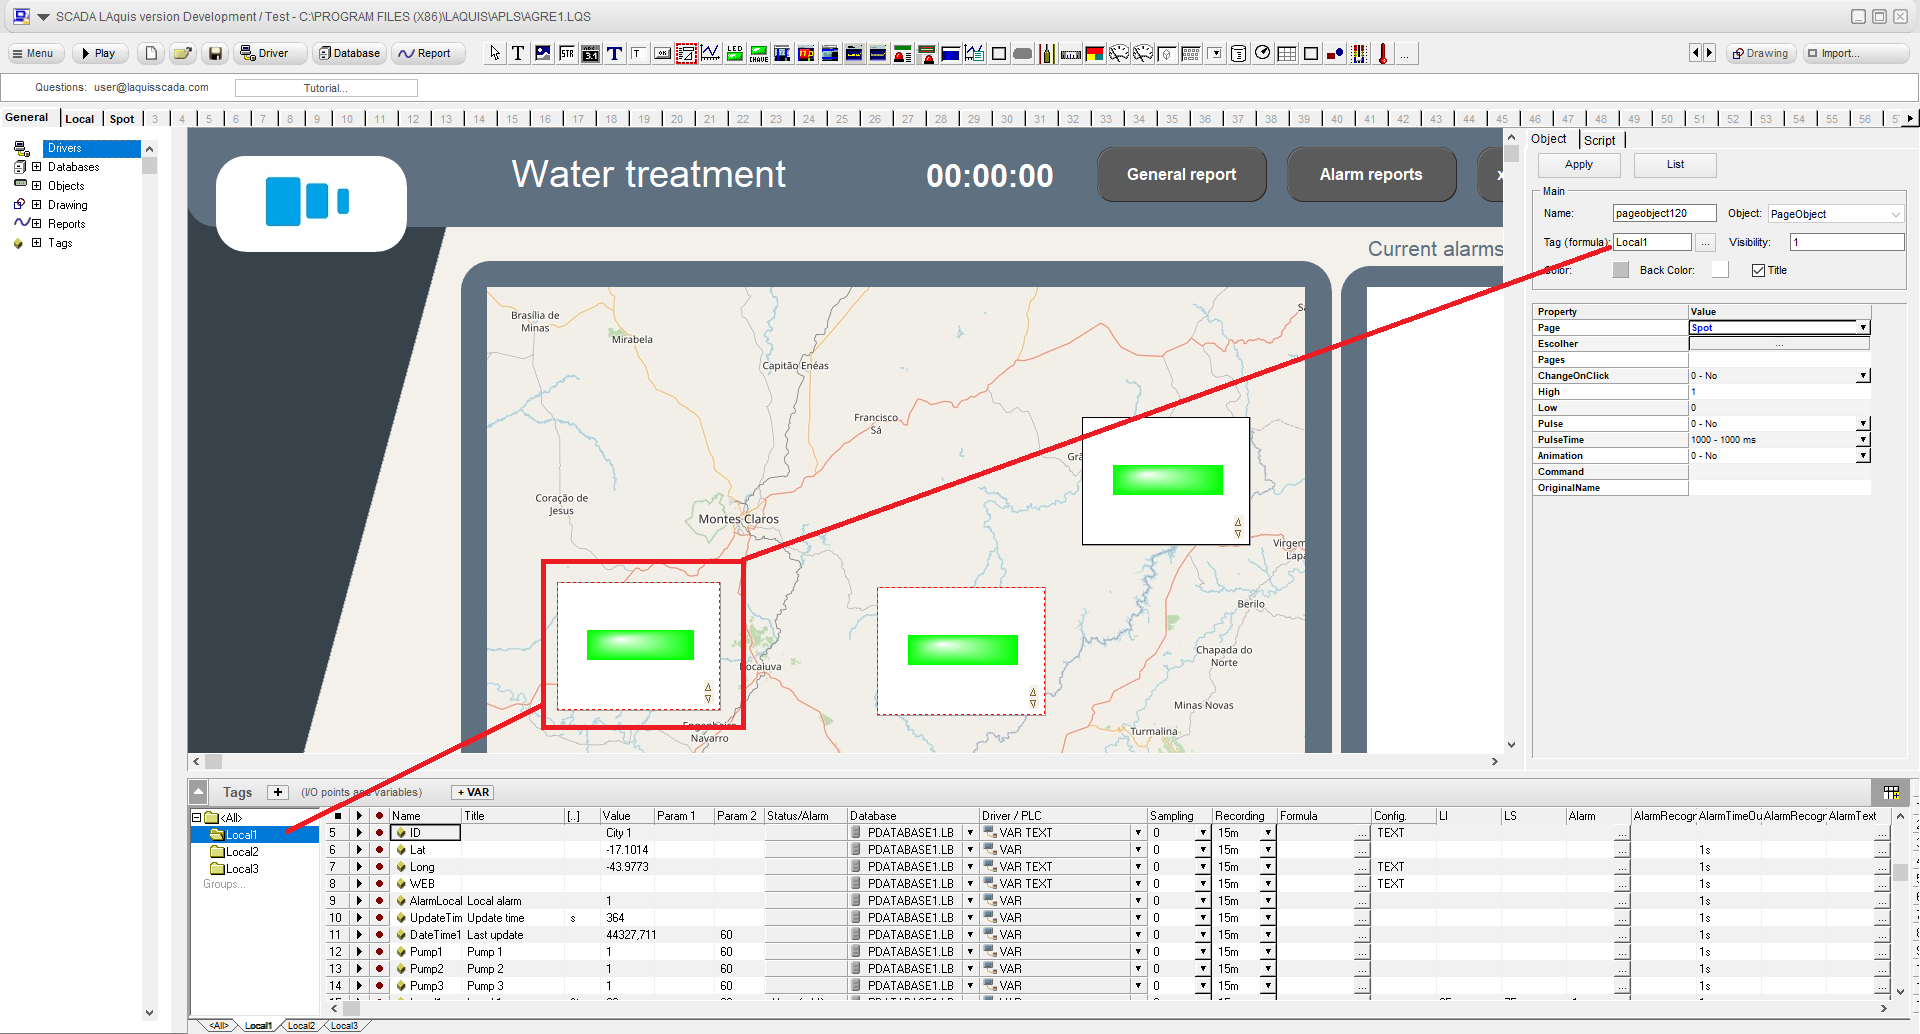
(To learn how to create page objects and organize as groups, follow the main basic step by step here.)
In design mode, in this example, each “Spot” page object must be associated with a location (Local1, Local2, Local3, …):
(To learn how to associate the visual objects with tags and animations, go here.)
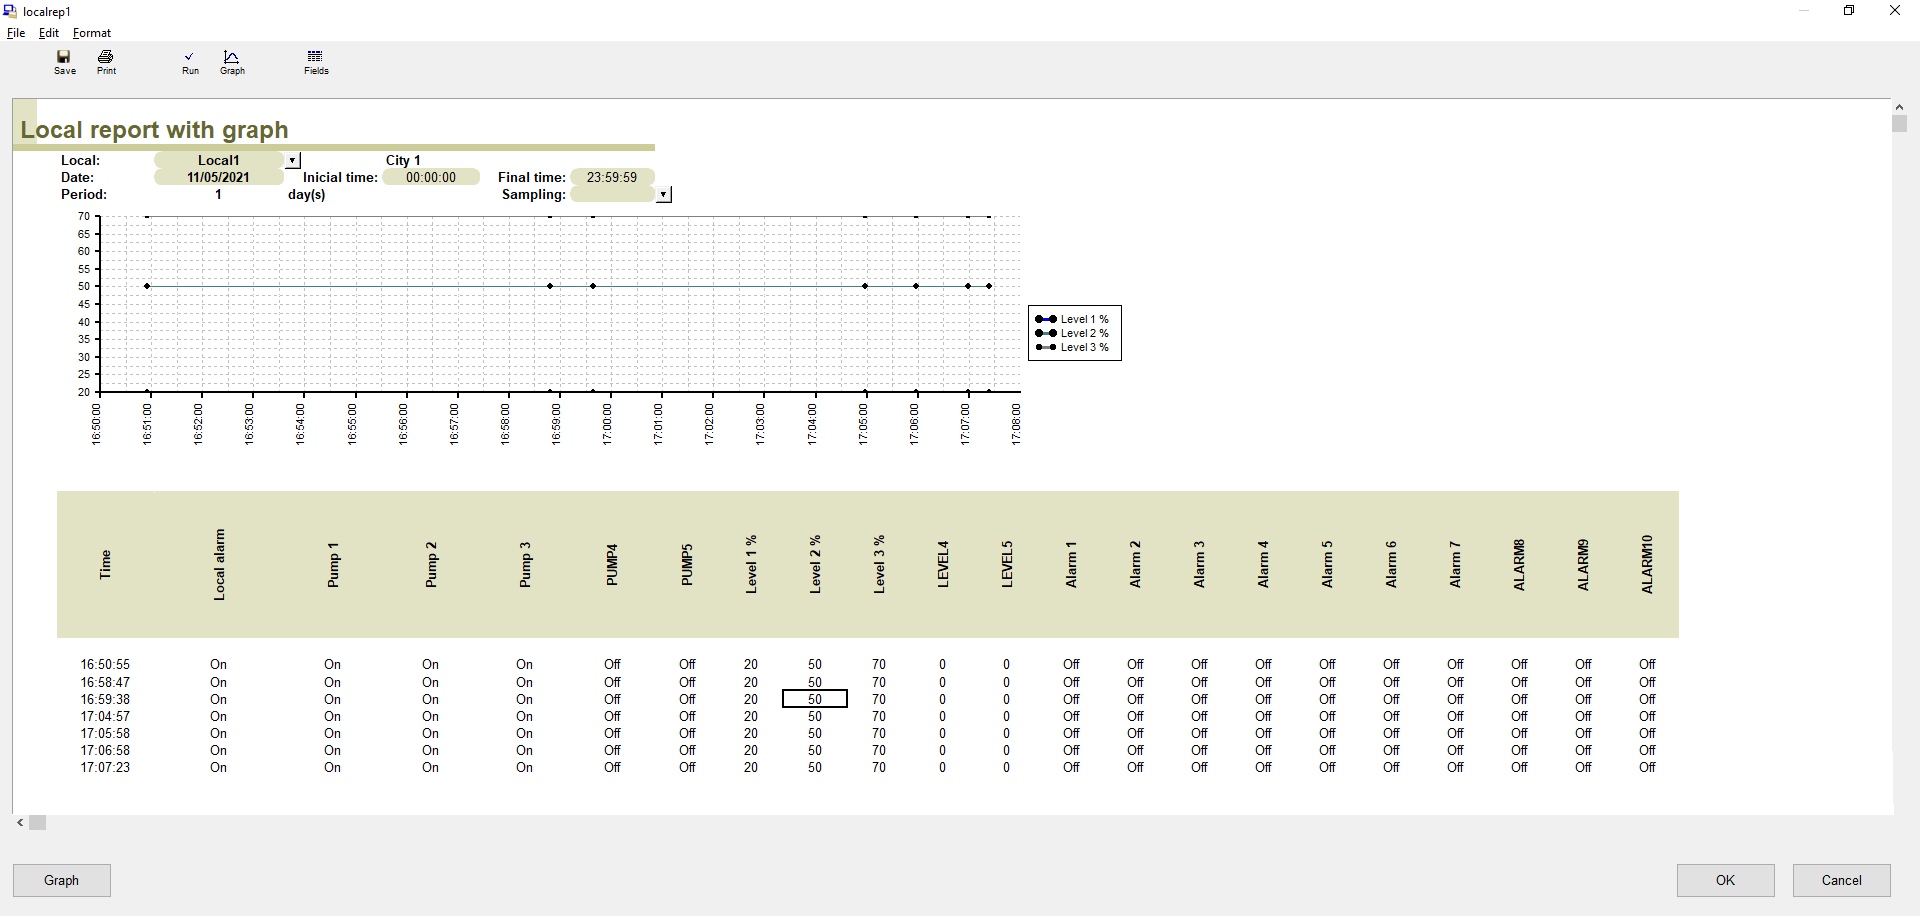
The reports can be for each location or generic.
(To learn how to create reports, go here.)
An option of telemetry using MQTT:
Example using MQTT:
