
Generally, the database is owned by LAquis for large amounts of data.
(If you want, previous step – Step 3 – Panels )
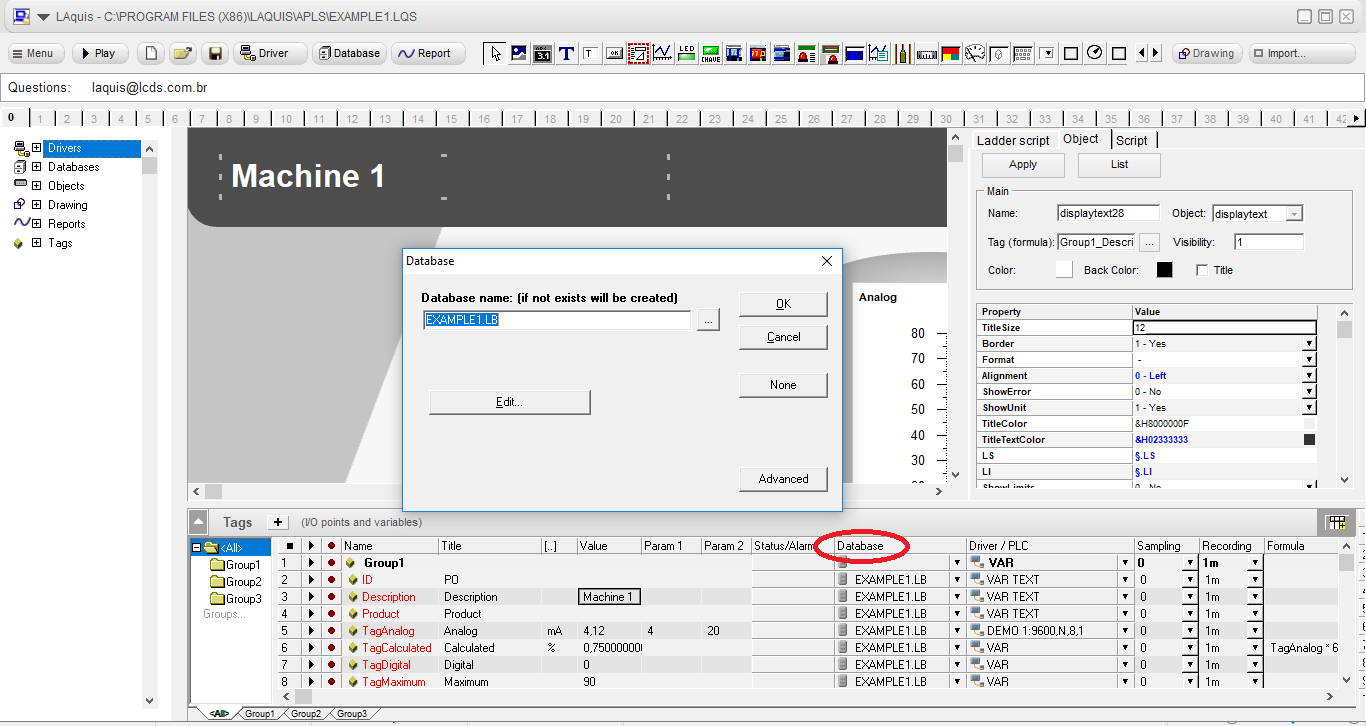
To create a database, click on the title of the Database column and type the name of the database. You can usually use the name of the application itself with the extension .LB. The database is generally the same for all groups. Within the records the group name is placed to separate later automatically.
In this example we will put it like this:
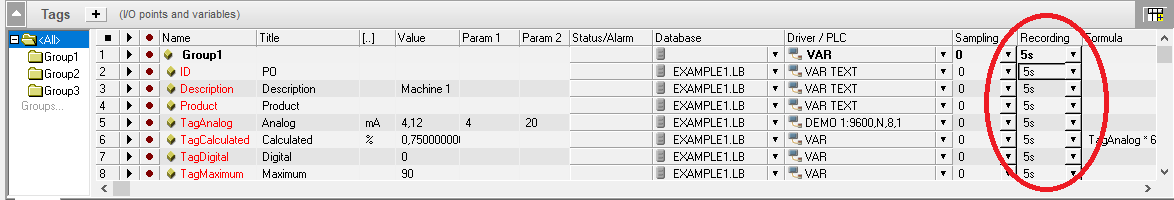
If desired, you can optionally select the interval between each recording of the data in the Recording column. For example, every 5 seconds:
Click the Play button for the supervisor to automatically create the database using the selected tags.

Wait a while, then click Stop to continue editing.

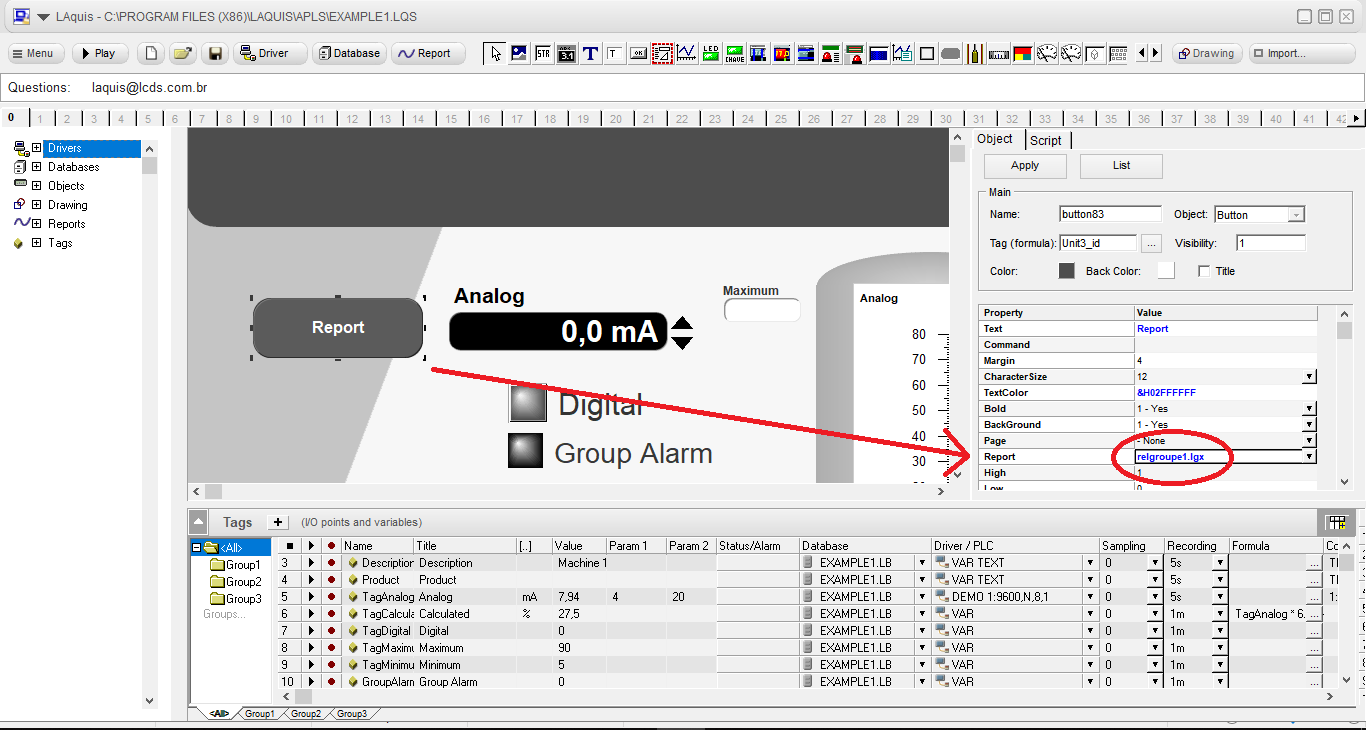
We will put a button to call the report. Select the button on the bar and associate it with a tag from this group like this:
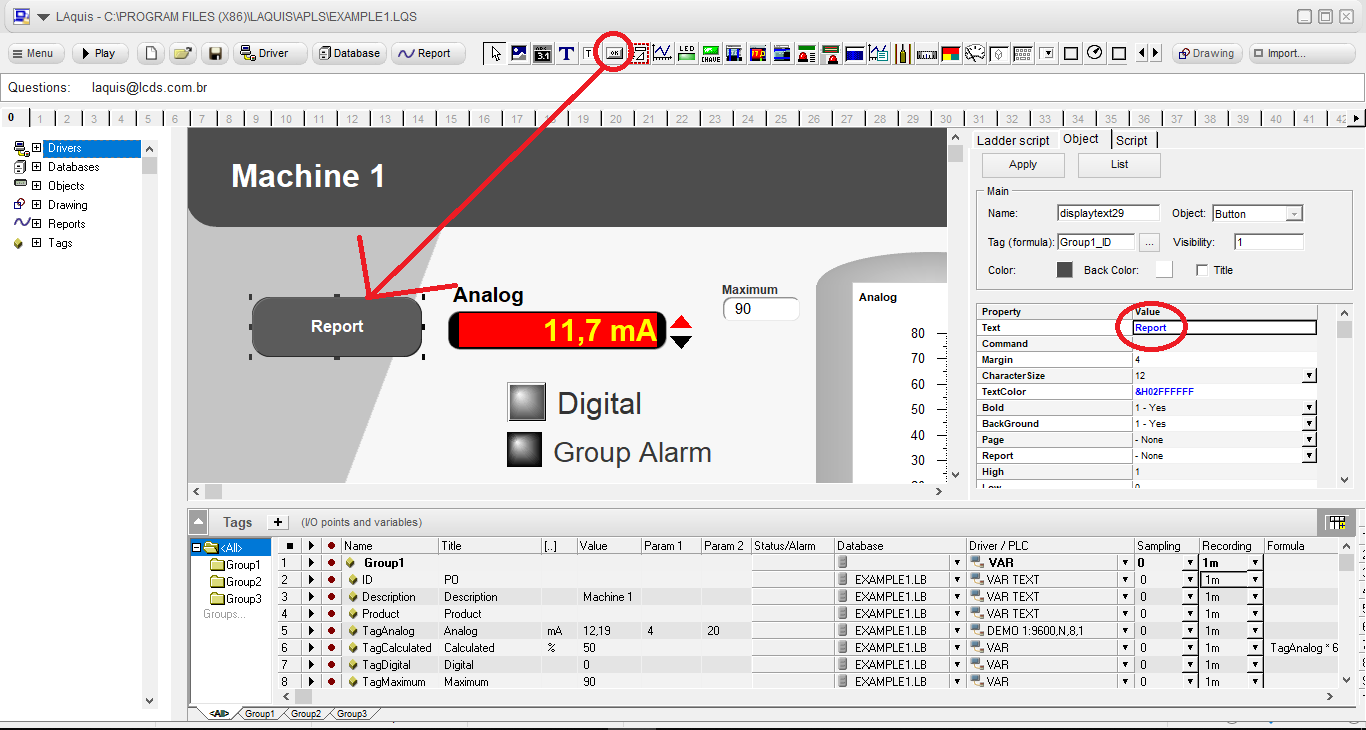
One way to create a report is to click on the Report button and then put the name of the report format in the Report property of the button
Another way to create a report, which is how we will do it next is, right-click on the button, click Report on this button, select, for example, the General model with graph and OK.
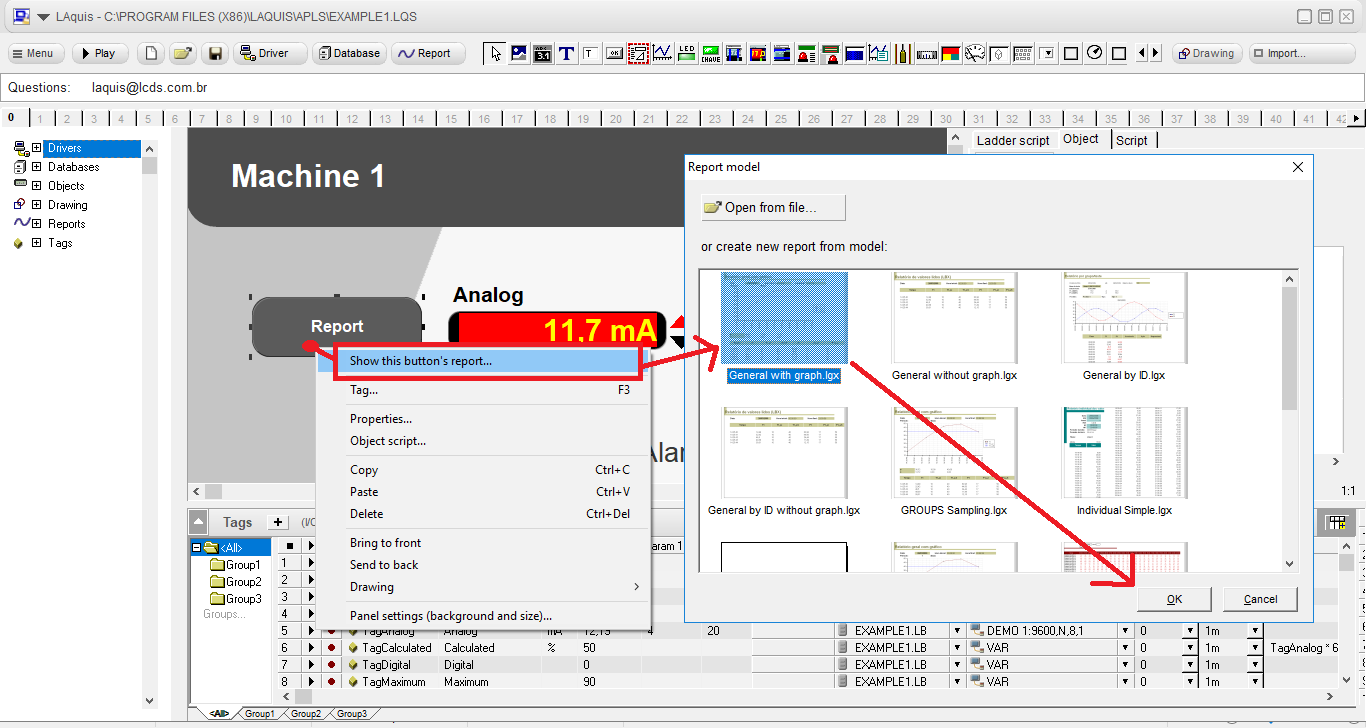
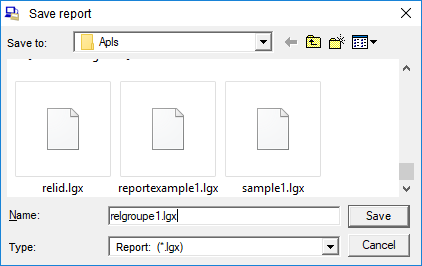
It will ask you to enter a name for the report format file. This name will be automatically placed in the Report property of the button object.
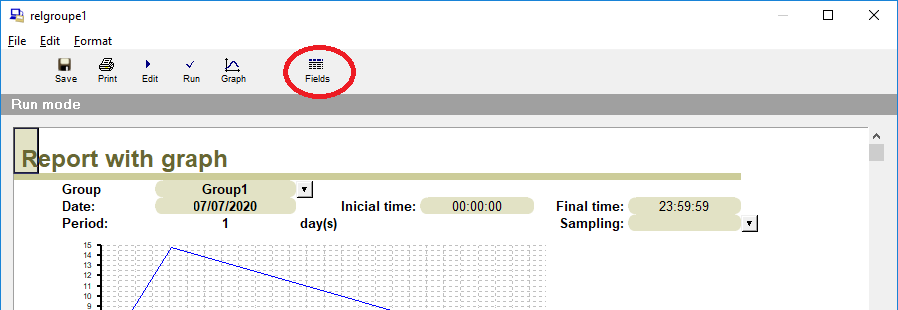
The report will open.
The report format is a generic spreadsheet focused on automation, statistics, quality calculations, etc …
In this case we are going to click on the Fields button to change the fields to be shown in the listing of this model like this:
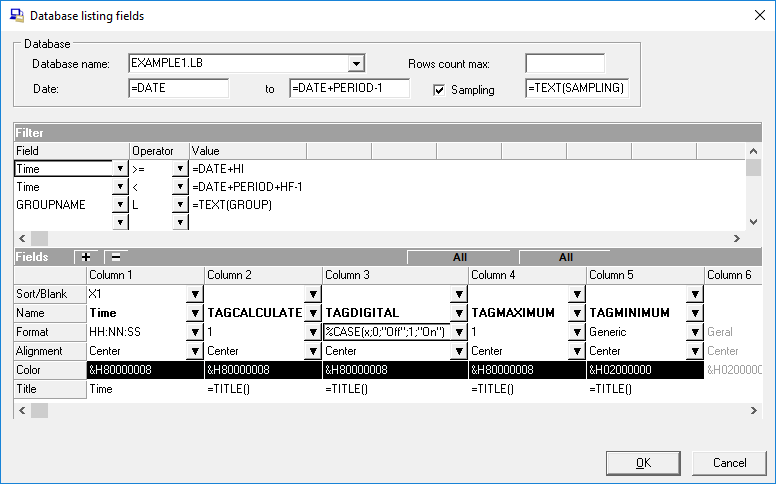
Define the fields and their attributes to be shown in the listing. In this case TAGCALCULATED, TAGDIGITAL, TAGMAXIMUM and TAGMINIMUM.
In this case, the format attribute of TAGCALCULATED was 1 decimal place.
The format of TAGDIGITAL was this %CASE (X;0;”OFF”;1;”ON”). If the tag is 0, the text shown will be Off. If it is 1 On. You can use the %TAG (STATUS) format if the statuses are already defined in the tags in the status column.
The titles of the tags can be automatic or written manually:
Click on OK and back to the report.
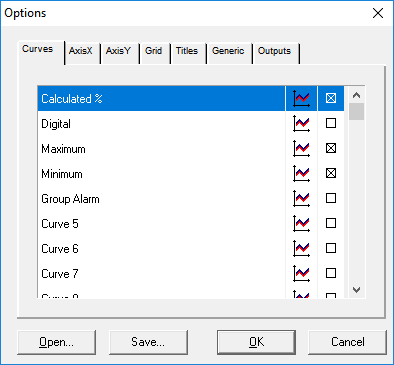
To change the tags to be shown on the chart and their colors, double click on chart, configure the curves to be displayed and click on OK.
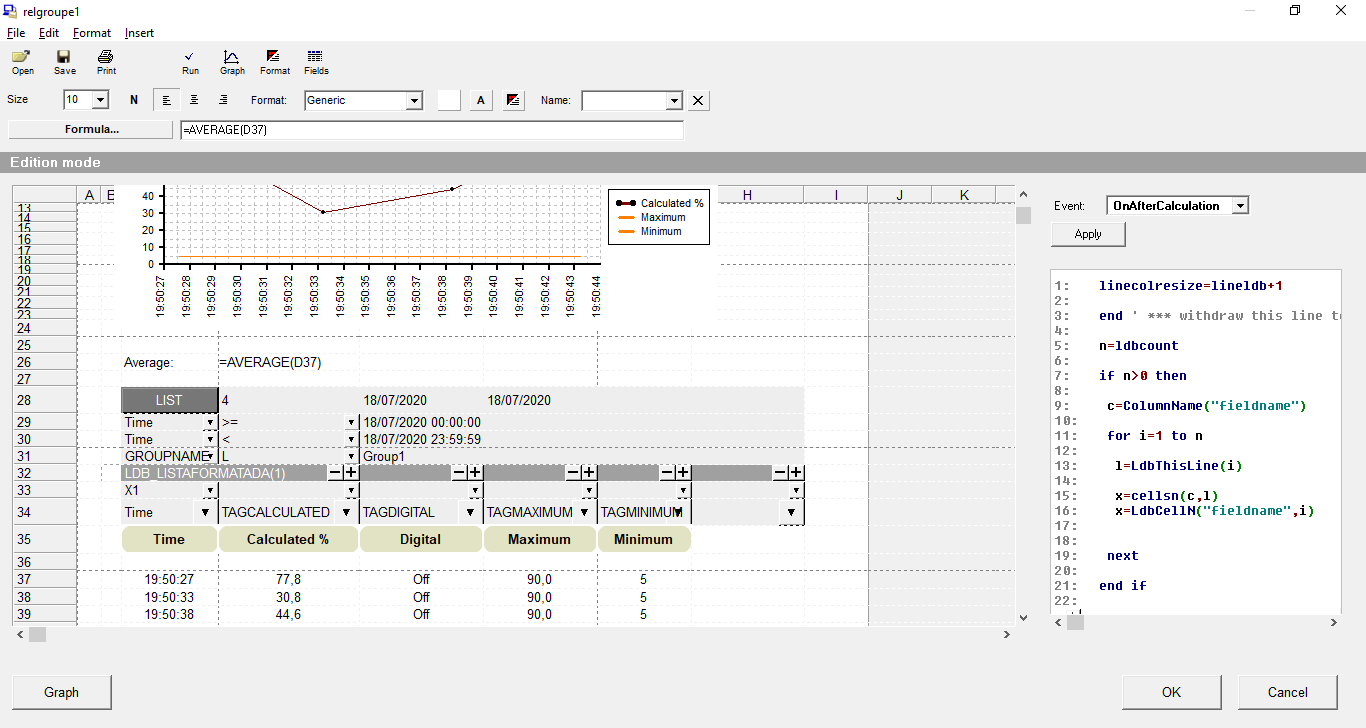
If you want to edit in the advanced mode click on Edit:
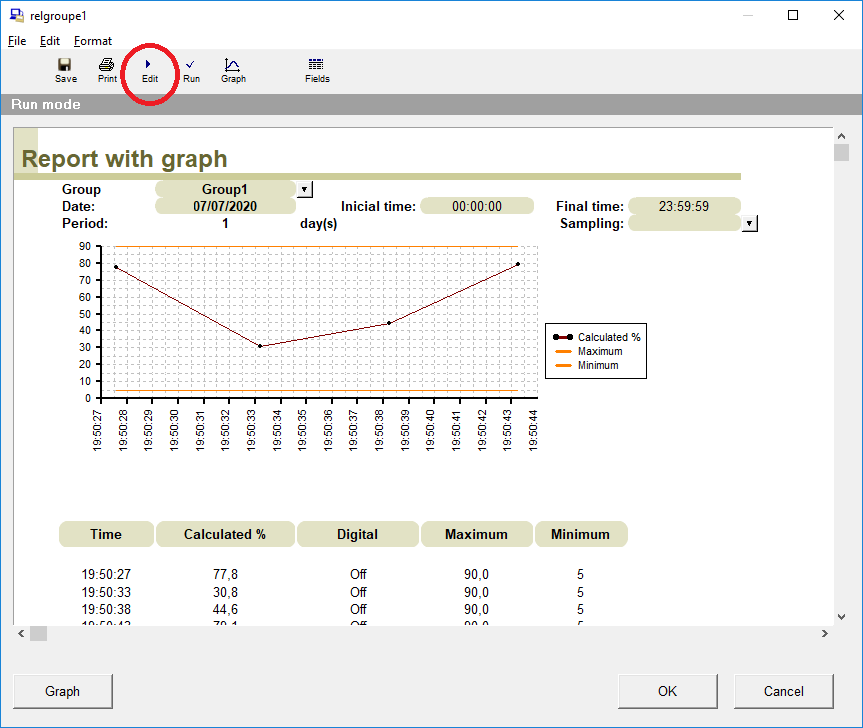
The report is open to edition. Layout, formulas and script.
It can be printed or exported to PDF.
When exiting the report, click on the button and check that the file name of the report format is in the button’s Report property. If, then, the application is running, clicking the report button will generate the report.
Next step: Step 5 – Alarm bank